Weathermap4RRD: Creating Monitoring Maps
Introduction
Do you like looking at the network maps on Free or OVH websites? Would you like to have the same for your own network? That's what we'll do in this article, which is primarily aimed at network administrators.
For this article, we'll be using Cacti and a variation of the original Weathermap: Weathermap4RRD. This fork is not based on MRTG like the original Weathermap, and we'll take advantage of this difference.
Established fact: admins are lazy. Therefore, we hate doing the same tedious task twice: machines are here to do it for us.
For this article, I assume that our Cacti is working properly and measuring various links across different sites. It produces RRA files (Round Robin Archive, where Cacti stores its measurements) from which it generates graphs that our busy decision-makers enjoy viewing. We'll be using these files: they contain all the data Weathermap4RRD will need. One measurement and (at least) two graphical outputs - great, isn't it?
Installation
Nothing could be simpler on a Debian (or any apt-enabled distribution):
Yes, that's it: we'll see the configuration of Weathermap and the graphs once we have a clear view of our plan of attack.
Configuration
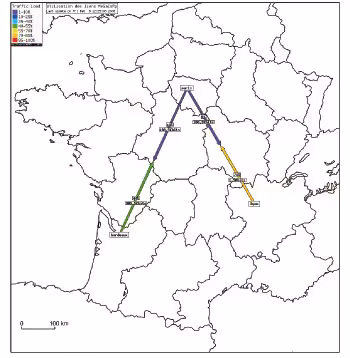
I'm going to reuse real data here, only the names have been changed. The network topology is as follows: a datacenter in Paris, a remote site in Lyon, and another remote site in Bordeaux. The connection between Paris and Lyon has a bandwidth of 10 Mb, and the one between Paris and Bordeaux has a bandwidth of 2 Mb. So we'll have 3 locations to place and 2 lines to draw on the graph: Paris/Lyon and Paris/Bordeaux.
The necessary and tedious part is identifying in Cacti the names of the RRAs that correspond to the measurements taken for each site.
To do this, we'll use the Cacti web interface. In the console, "Data Sources" section, select (using search if needed) the data source corresponding to the network bandwidth for each site. The info we're interested in is the "Data Source Path", for example <path_rra>/router_lyon_254_traffic_in_334.rrd.
On a Debian, the default <path_rra> is /var/lib/cacti/rra/.
This operation must be performed for each location to be represented and for each interface that is the starting point of a line. It's time-consuming, but it only needs to be done once. Now we have all the necessary information to get started.
Each graph has its configuration file; in our case we'll use /etc/weathermap4rrd/weathermap4rrd.sites.conf.
For the graph, we'll choose a map background (Google images will help us find one) to make our graph more meaningful and pleasant to look at.
The configuration file /etc/weathermap4rrd/weathermap4rrd.sites.conf:
A quick test to make sure everything is working properly:
And our result is in /var/www/weathermap/weathermap_sites.png. We can make some position adjustments or other cosmetic checks.
Not working? Don't panic, use the --debug switch on the command line to get more information about what's happening.
The hardest part is done, but now we need to automatically update this data and present it to the world.
Publish the Graphs
We'll quickly define a virtualhost for our application:
We also need a small script to regenerate all this:
We'll create the following entry in the crontab:
To recreate the graphs every 2 minutes, even though Cacti polls by default every 5 minutes, we'll have more "up-to-date" data this way.
As a finishing touch, this script creates a thumbnail with convert (from the ImageMagick package) at 25% of the original size, which will perfectly complement the (very basic) page to use as an index for our vhost:
That's it! This article is finished and I hope it has inspired you to do the same thing in your environment.