![]()
Introduction
RRDtool is a Round-Robin Database (RRD) management tool created by Tobi Oetiker. It is used by many open source tools, such as Cacti, collectd, Lighttpd, and Nagios, for saving cyclical data and plotting chronological data graphs. This tool was created to monitor server data, such as bandwidth and CPU temperature. The main advantage of an RRD database is its fixed size.
RRDTool also includes a tool to graphically represent the data contained in the database. RRDTool is free software distributed under the terms of the GNU GPL.
I had to use RRD to graph disk usage of several user folders (e.g., /home/users/*).
-
Overview of how RRDtool works:
-
Create an empty RRD database that will contain the data to graph
- Update RRD data using the "rrdtool update" command or via a script
- Generate graphs with the "rrdtool graph" command
Managing an RRD Database
The RRD database uses a defined number of records. Each addition is placed at the head of the database and the others gradually shift, and so on. There can therefore be no overflow since it's controlled. The only issue with all this is that you need to know the number of records you want to keep. For example, you may want a day or a month, which are not the same.
Creating a Database
First, let's create the database:
With the create argument, RRDtool will create the database that will contain all the necessary fields. This database doesn't contain any data yet. Then:
- temptrax.rrd: this is the name of the database and its location
- --start N: gives an indication of when the graph starts. Here I use N to say now. But I can use a date in epoch format.
- --step 300: indicates the interval time in seconds when data will arrive in the database (here 5 min)
- DS: specifies the different data sources. Here I have 4 temperature probes followed by the name (DS-Name) I want to assign them.
- GAUGE: This is a DST (Data Source Type). There are several of them:
| DST Type | Description |
|---|---|
| GAUGE | This is the most common, and generally the best choice |
| COUNTER | This is a counter that will increment continuously |
| DERIVE | Will record the drift of the previous and next values |
| ABSOLUTE | Records values and resets them after each reading |
- 600:55:95: These last three fields mean:
- 600: The minimum heartbeat in seconds (after this delay, the value will become unknown if the database has not received anything during this period)
- 55: Minimum possible value (outside of which the value will be unknown)
- 95: Maximum possible value (outside of which the value will be unknown)
For these two values above, if you don't know what to put, use 'U' for unknown (e.g., DS:probe1-temp:GAUGE:600:U:U)
- RRA: RRA stands for Round Robin Archives. These are like views in which data will be stored. In each RRD database, RRAs are stored separately with a defined number of records. With each new record in the database, a PDP (Primary Data Point) is added which will be combined with it and placed in our RRA in a CF (Consolidation Function). It will determine the current value to write.
- MIN: This is the type of CF we use. There are others such as:
| CF Type |
|---|
| AVERAGE |
| MIN |
| MAX |
| LAST |
- 0.5: This is an XFF (XFiles Factor) which is a percentage of PDPs that can be unknown without receiving unknown values.
- 12: This is the number of PDPs that will make up the recorded value.
- 1440: This is the number of records that the RRA should contain.
To summarize: I create an RRD database called temptrax.rrd which will:
- start now
- be updated every 5 minutes
Additionally:
- I have 4 different data sources with 1 probe of type GAUGE.
- If my data source is not updated at least every 10 minutes and the value is not between 55 and 95, then the value will be unknown.
I also have 3 types of RRA:
- 2 are for min and max values using 12 PDPs allowing 50% of them to be unknown
- We can record up to 1440 records
Knowing that we normally update every 5 min, and we use 12 PDPs (each update is a PDP). This means that:
- we add one record every hour (5 mins * 12)
- we make 1440 records
This gives us 60 days (1440/24h) of RRA. Each min and max value collected in PDP will be used as a value for the RRA.
In the last RRA, we use an average of collected PDPs, allowing 50% unknown, but we use only one PDP per record (so each update). We make 1440 records which means this RRA will record (1440/12 updates per hour/24h) 5 days of data. In a future case, we will see that with a simple PDP, the CF is not very important and you will probably have used LAST.
Updating a Database
Updating can be very simple or very complicated depending on the type of graphs. For usage, however, it is very simple and takes this form:
Generally this command is placed at the end of a script that has retrieved all the data via SNMP or other means to pass a return result as an argument. If we break down the command, it gives us:
- \<file.rrd>: the location with the rrd file
- timestamp: the update time (as above, "N" means now)
- val1[:val2:...]: the values are separated by ":" and there must be as many as declared DS and in order!
Here is a crude example to update data:
Additionally, you will need to set up this kind of script in crontab to automatically update the data. Otherwise, you can create a loop to update (a bit cruder).
Modifying the Data Insertion Order
If you want to change the order of data insertion, you can do this:
However, remember that data already inserted has been entered in a specific order, if you change it, the graph history will be incorrect.
Generating Graphs
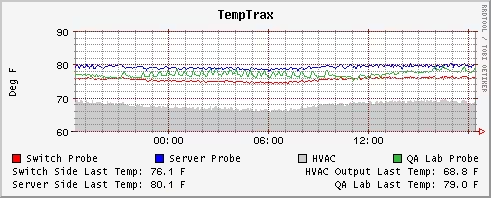
We will use rrdtool graph to generate a graph from our rrd database. There are tons of options for this command. We will only see the basics here. Here's what we're going to run:
To eventually get this:
Let's break down what this does:
- mygraph.png: path and name of the graph to generate
- -a PNG: type of image file to generate. By default it's gif, but you can force PNG or GD.
- --title: The title to display at the top of the graph
- --vertical-label: Name to give the Y axis
- DEF: These are just virtual names (vname) that we give to DS. It is strongly recommended to use vnames! Indeed, since we can use multiple RRD databases to make a graph, if we have DS with the same name, there will be undesirable effects.
- probe1: name of the vname
- temptrax.rrd: rrd database to process
- rrd:probe1-temp: the name of the original DS
- AVERAGE: The type of CF we are interested in specified in the RRA
- LINE1|AREA: These are the type of graph we want to make. For more examples click here to see available graphs.
- probe4: the corresponding vname
-
35b73d: Curve color in hexadecimal format
- QA Lab Probe: Legend name displayed at the bottom of the graph
- GPRINT: These lines allow additional information to be placed at the bottom of the graph. It is generally nice to see the
- probe1: the corresponding vname
- LAST: This is the last CF data in the database (because I use LAST)
- Switch Side Last Temp:: This is the line to be displayed at the bottom of the graph
- %2.1lf: used to display a numeric value with 1 decimal place (see the documentation for printf or sprintf for all possibilities)
- \j: allows right alignment
Different Types of Graphs
- LINE type graph:
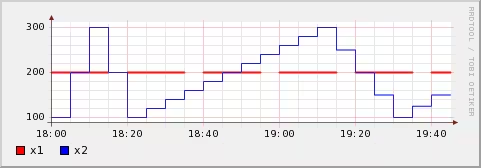
You can specify several types of lines (LINE1, LINE2, LINE3, LINE4). The higher this number, the more the corresponding line will be above lines of lower numbers.
- AREA type graph:
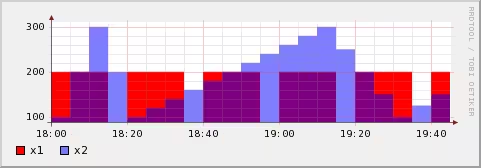
AREA allows you to fill the lower part of the graphs.
- STACK type graph:

Allows you to stack the graphs.
Generating Historical Graphs
The concept is quite simple. Our initial RRD database must collect sufficient time for us to make the graphs we are interested in (e.g., we need at least 3 weeks in the database if we want to make graphs over 3 weeks of history).
However, we will use 2 new arguments: --start and --end. By default, graphs are made over 24 hours. By adding these parameters, we can specify a start and end:
- --end: by default it's now. And it is generally practical to leave the default.
- --start: This is the start date of the graph which can be specified in several formats:
- epoch: you can specify the date in seconds since January 1, 1970
- days: you can specify a day of the week "monday" for example
- weeks: you can ask for the last 2 weeks "-2weeks"
- month: you can ask for last month "-1month"
- year: And finally, the year "-1year"
In short, the notation is relatively easy as you can see. Check the man page for rrdfetch if you want more info.
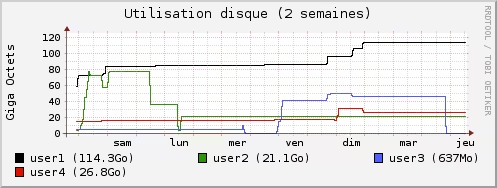
Example
Here's an example I propose of something I developed to have graphs on the size occupied by users on their home directory. This will give me something like this:
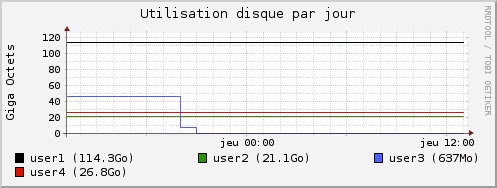
Creating the RRD Database
All my scripts are stored in a folder /etc/scripts/. So if you want to play copy/paste, create this folder.
So we'll create the database like this:
Adapt the part of user names and RRD database (/stats/rrd_db.rrd) to what you want.
Generating a Data File
Next we'll make a small script that will generate a data file that can be picked up by OpenChart and RRD (well, something a bit generic and easy to parse).
Again, adapt the users, user colors, source and destination:
1 2 3 4 5 6 7 8 9 10 11 12 13 14 15 16 17 18 19 20 21 22 23 24 25 26 27 28 29 30 31 32 33 34 35 36 37 38 39 40 41 42 43 44 45 46 47 48 49 50 51 52 53 54 55 56 57 58 59 60 61 62 63 64 65 66 67 68 69 70 71 72 73 74 75 76 77 78 79 80 81 82 83 84 85 86 87 88 89 90 91 92 93 94 95 96 97 98 99 100 101 102 103 104 105 106 107 108 109 110 111 112 113 114 115 116 117 118 119 120 121 122 123 124 125 126 127 128 129 130 131 132 133 134 135 136 137 138 139 140 141 142 143 144 145 146 147 148 149 150 151 152 153 154 155 156 157 158 159 160 161 162 163 164 165 166 167 168 169 170 171 172 173 174 175 176 177 178 179 180 181 | |
Updating the Database
Now for updating the database, we'll need to put a script in crontab to update it:
Adapt the source and destination here.
Generating Graphs
To generate the graphs, we'll need to define where the images will be stored. For this, adapt the source, rrd_db and the 2 destinations. There will be one image for the day graph and one image for the 2-week graph:
Now, we have everything we need to create, update and generate graphs. Let's just set the proper execution rights:
And finish by defining the crontab: