OProfile: Profile Your System
![]()
Introduction
Profiling
OProfile is a tool used for profiling.
Profiling is the process of examining data from various existing data sources (databases, files, etc.) and collecting statistics and information about this data. It is very similar to data analysis.
Profiling objectives include:
- Identifying reusable data for other purposes
- Getting measurements on data quality and compliance with company standards
- Evaluating risks generated by integrating this data into new applications
- Evaluating if metadata correctly describes source data
- Having a good understanding of the impact of source data on upcoming projects to anticipate surprises. Late discovery of data problems can lead to delays and budget overruns (e.g., having to modify a code format in hundreds of places across projects, having to rebuild associated references, having to rediscuss and revalidate contractual documents, etc.)
- Having a global view of the data to allow reference data management or data governance to enhance data quality
OProfile
OProfile can profile:
- Interrupts
- Applications and shared libraries
- Complete system performance
- Events at regular intervals
One big advantage is that it uses minimal system resources.
OProfile disadvantages:
- One major drawback of OProfile is that it can miss captures
- You need to install many development packages to use it, which isn't always feasible in production environments
To better understand how OProfile works, here's a diagram:
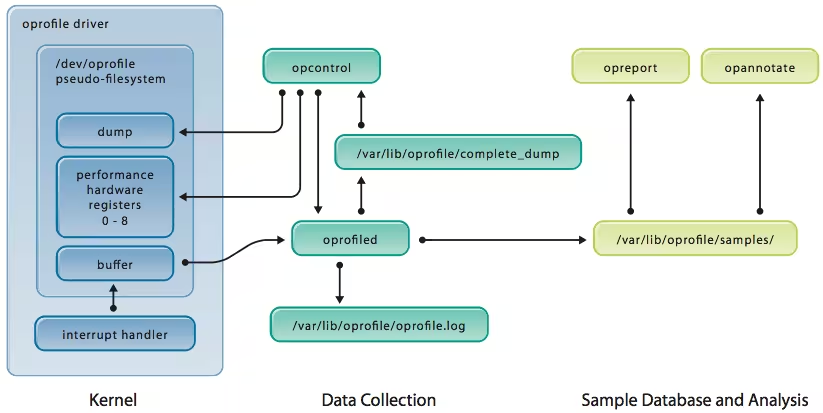
OProfile aims to be as unintrusive as possible. OProfile loads a kernel driver at boot time that manages hardware performance based on processor counting. The /dev/oprofile device serves as an interface with user mode. The daemon reads this device and stores information in /var/lib/oprofile/samples.
Installation
Red Hat
On Red Hat, here's what we'll install:
To ensure OProfile will work properly, let's check that it's present in the kernel:
Only the first two highlighted lines are essential; the others can be useful but are not mandatory.
Now we need the kernel debug tools:
Note: kernel-debug is different from kernel-debuginfo
Usage
Setup
Before using OProfile, you need to define what type of application you want to profile.
- If you want to profile the kernel, we need to make OProfile start at system boot. Add this line (
/etc/rc.local):
- If you want to profile an application, then execute this:
It's possible to reduce the profiling scope. Here's an example:
Test
Let's run a test. First, we'll reset the current data:
Then we'll start profiling:
Now run the desired tests, and OProfile metrics will be periodically saved under /var/lib/oprofile/samples/. To force this:
Then we'll stop profiling:
View Results
For all applications:
If we look at the oprofile.data file, we find this interesting information (~/oprofile.data):
- samples: Shows how many times the executable was called
- %: The percentage of CPU time spent executing each executable
If you want to profile just one application:
FAQ
Why is the CPU time at 0%?
This is because APIC is not enabled. Make sure idle=pool is in grub. Then check that it's enabled in /proc/cmdline.
Resources
Red Hat documentation: /usr/share/doc/oprofile-*/oprofile.html