Fluentd: Quickly Search in Your Logs with Elasticsearch, Kibana and Fluentd
![]()
| Software version | 1.1.19-1 |
| Operating System | Debian 7 |
| Website | Fluentd Website |
| Others | Elasticsearch 1.1 Kibana 3.0.1 |
Introduction
Managing logs is not a complicated task with classical syslog systems (syslog-ng, rsyslog...). However, being able to search in them quickly when you have several gigabits of logs, with scalability, with a nice graphical interface etc...is not the same thing.
Fortunately today, tools that permit us to do it very well exist. Here are the list of tools that we're going to use to achieve it:
- Elasticsearch^1: Elasticsearch is a flexible and powerful open source, distributed, real-time search and analytics engine. Architected from the ground up for use in distributed environments where reliability and scalability are must-haves, Elasticsearch gives you the ability to move easily beyond simple full-text search. Through its robust set of APIs and query DSLs, plus clients for the most popular programming languages, Elasticsearch delivers on the near limitless promises of search technology
- Kibana^2: Kibana is Elasticsearch's data visualization engine, allowing you to natively interact with all your data in Elasticsearch via custom dashboards. Kibana's dynamic dashboard panels are savable, shareable and exportable, displaying changes to queries into Elasticsearch in real-time. You can perform data analysis in Kibana's beautiful user interface using pre-designed dashboards or update these dashboards in real-time for on-the-fly data analysis.
- Fluentd^3: Fluentd is an open source data collector designed for processing data streams.
All those elements will be installed on the same machine to make it simpler at start. Fluentd is an alternative to Logstash. They both are data collectors, however Fluentd permits sending logs to other destinations:
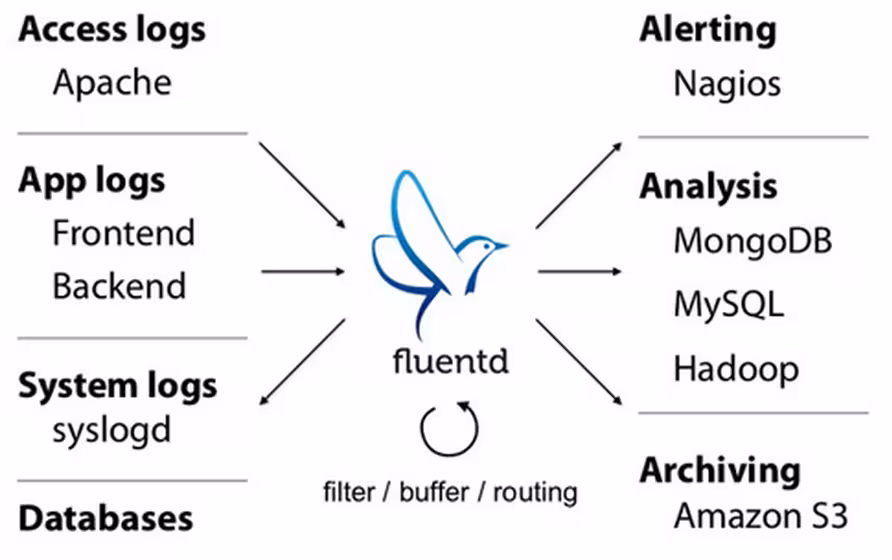
Here is what kind of infrastructure you can setup (no redundancy here, just a single instance):

To avoid dependencies issues and make things simpler, we're going to use fluentd as forwarder here to transfer syslog and other kinds of logs to another fluentd instance. On the last one, Elasticsearch and Kibana will be installed.
Installation
Elasticsearch
The first thing to put in place is the backend that will store our logs. As we want the latest version, we're going to use the dedicated repository:
Then we're ready to install:
To finish, configure the auto start of the service and run it:
Kibana
Regarding Kibana, there is unfortunately no repository at the moment. So we're going to use the git repository to make it simpler. First of all, install a web server like Nginx:
Now clone the repository and use the latest version (here 3.0.1):
You can get the list of all versions with git tag command.
You now need to configure Nginx to get it provided properly:
To finish for Kibana, edit the configuration file and adapt the elasticsearch line to your need:
Restart Nginx service to make the web interface available to http://
Fluentd
Fluentd is now the last part that will permit sending syslog to another Fluentd or Elasticsearch. So this has to be done on all Fluentd forwarders or servers.
First of all, we'll adjust system parameters to be sure we won't face performance issues due to it. First, edit the security limits and add these lines:
Then we're going to add the sysctl tuning in that file:
And apply the new configuration:
We're going to add the official repository:
However, during the time I'm writing this documentation, there are no Wheezy version available (squeeze only) and there is a missing dependency on the libssl. We're going to get it from squeeze and install it:
We're now ready to install Fluentd agent:
Modify then the configuration to set the global configuration:
Restart td-agent service.
Elasticsearch plugin
By default, it doesn't know how to forward to Elasticsearch. So we will need to install a dedicated plugin for it on the server, not on the forwarders. Here is how to install it:
Configuration
Here you will see how to configure multiple options of Fluentd. Choose the ones you want to add to your Fluentd instances (can have several). Here is a good example of what is needed in this kind of configuration:

Forwarders
To make a Fluentd forwards data to a receiver, simply create that configuration file and set the Fluentd node to forward to:
Receiver
If you want your node to be able to receive data from other Fluentd forwarders, you need to add this configuration:
In that use case, you need to add this on the server role of Fluentd.
Rsyslog
By default, Debian is using Rsyslog and we're going to see here how to forward syslog to Fluentd. First of all, on the Fluentd forwarders, create a syslog file containing the configuration as follows:
And restart td-agent service. It will create a listening port for Syslog.
Then simply add this line to redirect (in addition to the local files) syslog to Fluentd:
Restart Rsyslog service.
Log files
You may want to be able to log files as well. Here is a way to do it for a single access file from Nginx logs:
Then restart the td-agent service.
Nginx
The problem of the basic example above is each element is passed on a single line. That means we can't filter accurately. To do it, you will need to split with regex each field and give them a field name. You also need to specify the time and date format. Here is how to do it for Nginx:
It may be complicated to create a working regex the first time. That's why a website called Fluentular (http://fluentular.herokuapp.com) can help you to create the format line.
Fluentd Elasticsearch
To send all incoming sources to Elasticsearch, simply create that configuration file:
Then restart the td-agent service.
Usage
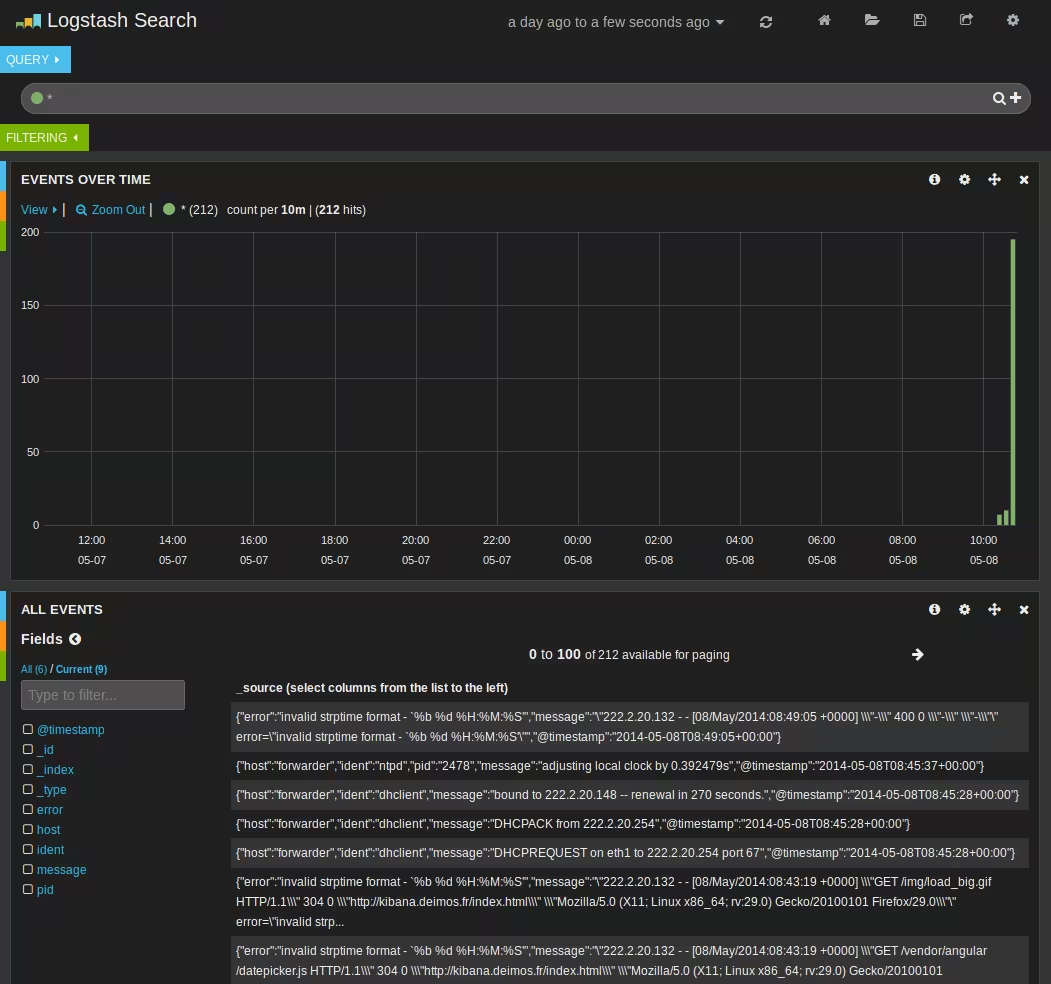
If you look at the web interface, you should have something like this:
You can now try to add other widgets, look at the official documentation^4.
References
- http://jasonwilder.com/blog/2013/11/19/fluentd-vs-logstash/
- http://repeatedly.github.io/2014/02/analyze-event-logs-using-fluentd-and-elasticsearch/
- http://www.devconsole.info/?p=917
- http://lifeandshell.com/install-elasticsearch-kibana-fluentd-opensource-splunk-with-syslog-clients/
- https://github.com/fluent/fluentd