Cacti Graphs Monitoring Scripts Create Your Own Graphs Ahhhh Cacti! It's wonderful when it works! Yes, yes, those beautiful graphs look great. However, it's true that when you want to create your own graph, that's a different story! So I found this comprehensive documentation that works perfectly as long as you follow it to the letter!
Documentation on creating a graph in Cacti
Now that you know how to create graphs, here are some scripts I made a while ago.
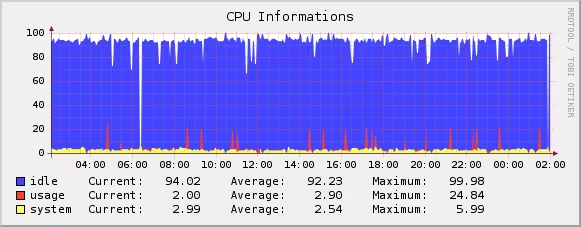
CPU Graph CPU Graph - /usr/share/cacti/site/scripts/cpu-stats.sh
MYTOP = ` top -b -n 2 | grep Cpu | tail -1`
USAGE = ` echo $MYTOP | awk '{ print $2 }' | awk -F"%" '{ print $1 }' | awk -F"." '{ print $1 }' `
SYSTEM = ` echo $MYTOP | awk '{ print $4 }' | awk -F"%" '{ print $1 }' | awk -F"." '{ print $1 }' `
IDLE = ` echo $MYTOP | awk '{ print $8 }' | awk -F"%" '{ print $1 }' | awk -F"." '{ print $1 }' `
typeset -i USAGE
typeset -i SYSTEM
typeset -i IDLE
printf "cpu_usage:%d cpu_system:%d cpu_idle:%d\n" $USAGE $SYSTEM $IDLE
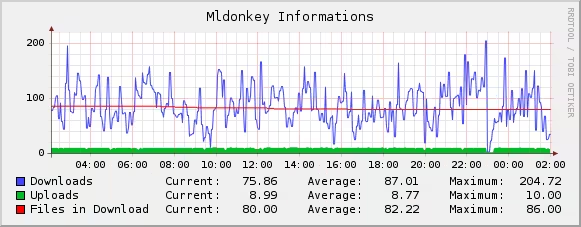
Mldonkey Graph Mldonkey Graph - /usr/share/cacti/site/scripts/mldonkey-stats.sh
MY_ML = ` mldonkey_command bw_stats -p "" | grep Down`
ML_DOWN = ` echo $MY_ML | awk '{ print $2 }' | awk -F. '{ print $1 }' `
ML_UP = ` echo $MY_ML | awk '{ print $11 }' | awk -F. '{ print $1 }' `
ML_FILES = ` mldonkey_command vd -p "" | grep "\[D " | wc | awk '{ print $1 }' `
typeset -i ML_DOWN
typeset -i ML_UP
typeset -i ML_FILES
printf "ml_down:%d ml_up:%d ml_files:%d\n" $ML_DOWN $ML_UP $ML_FILES
RAM Graph RAM Graph - /usr/share/cacti/site/scripts/ram-stats.sh
MY_RAM = ` free -o | grep "Mem:" `
RAM_TOTAL = ` echo $MY_RAM | awk '{ print $2 }' `
RAM_USED = ` echo $MY_RAM | awk '{ print $3 }' `
RAM_FREE = ` echo $MY_RAM | awk '{ print $4 }' `
typeset -i RAM_TOTAL
typeset -i RAM_USED
typeset -i RAM_FREE
printf "ram_total:%d ram_used:%d ram_free:%d\n" $RAM_TOTAL $RAM_USED $RAM_FREE
October 29, 2009 October 29, 2009