Weathermap4RRD: Creating Monitoring Maps
Introduction
Do you like looking at the network maps on Free or OVH websites? Would you like to have the same for your own network? That’s what we’ll do in this article, which is primarily aimed at network administrators.
For this article, we’ll be using Cacti and a variation of the original Weathermap: Weathermap4RRD. This fork is not based on MRTG like the original Weathermap, and we’ll take advantage of this difference.
Established fact: admins are lazy. Therefore, we hate doing the same tedious task twice: machines are here to do it for us.
For this article, I assume that our Cacti is working properly and measuring various links across different sites. It produces RRA files (Round Robin Archive, where Cacti stores its measurements) from which it generates graphs that our busy decision-makers enjoy viewing. We’ll be using these files: they contain all the data Weathermap4RRD will need. One measurement and (at least) two graphical outputs - great, isn’t it?
Installation
Nothing could be simpler on a Debian (or any apt-enabled distribution):
apt-get install weathermap4rrd
Yes, that’s it: we’ll see the configuration of Weathermap and the graphs once we have a clear view of our plan of attack.
Configuration
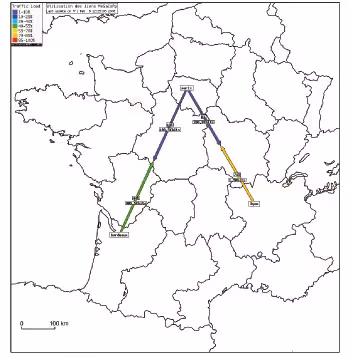
I’m going to reuse real data here, only the names have been changed. The network topology is as follows: a datacenter in Paris, a remote site in Lyon, and another remote site in Bordeaux. The connection between Paris and Lyon has a bandwidth of 10 Mb, and the one between Paris and Bordeaux has a bandwidth of 2 Mb. So we’ll have 3 locations to place and 2 lines to draw on the graph: Paris/Lyon and Paris/Bordeaux.
The necessary and tedious part is identifying in Cacti the names of the RRAs that correspond to the measurements taken for each site.
To do this, we’ll use the Cacti web interface. In the console, “Data Sources” section, select (using search if needed) the data source corresponding to the network bandwidth for each site. The info we’re interested in is the “Data Source Path”, for example <path_rra>/router_lyon_254_traffic_in_334.rrd.
On a Debian, the default <path_rra> is /var/lib/cacti/rra/.
This operation must be performed for each location to be represented and for each interface that is the starting point of a line. It’s time-consuming, but it only needs to be done once. Now we have all the necessary information to get started.
Each graph has its configuration file; in our case we’ll use /etc/weathermap4rrd/weathermap4rrd.sites.conf.
For the graph, we’ll choose a map background (Google images will help us find one) to make our graph more meaningful and pleasant to look at.
The configuration file /etc/weathermap4rrd/weathermap4rrd.sites.conf:
  # the map background
BACKGROUND /var/www/weathermap/france.png
# Its dimensions
HEIGHT 1140
WIDTH 1120
# The font size (from 1 to 5)
FONT 3
# Positioning of the link usage legend
KEYPOS 10 10

# The title of the graph
TITLE "Paris/Regional Links Usage"
# Its position
TITLEPOS 130 12
# Its color (black)
TITLEFOREGROUND 0 0 0

# The file to generate
OUTPUTFILE /var/www/weathermap/weathermap_sites.png

# Here we define the legend colors
#     low  high   red green blue
SCALE   1   10    140     0  255
SCALE  10   25     32    32  255
SCALE  25   40      0   192  255
SCALE  40   55      0   240    0
SCALE  55   70    240   240    0
SCALE  70   85    255   192    0
SCALE  85  100    255     0    0

# Definition of sites to represent
NODE paris
        POSITION 610 300
        LABEL paris

NODE bordeaux
        POSITION 380 800
        LABEL bordeaux

	NODE lyon
        POSITION 840 694
        LABEL lyon
# Definition of links to represent
LINK paris-bordeaux
        NODES   bordeaux paris
        TARGET  /var/lib/cacti/rra/routeur_bordeaux_254_traffic_in_318.rrd
                INPOS   1
                OUTPOS  2
                UNIT    bytes
                # 2Mb
                BANDWIDTH 2048
                DISPLAYVALUE 1
                ARROW   normal
                GROUP   sites
                INTERNODEDISPLAY 50
# We reuse the "nodes" defined just before
LINK paris-lyon
        NODES   lyon paris
        TARGET  /var/lib/cacti/rra/routeur_lyon_254_traffic_in_334.rrd
                INPOS   1
                OUTPOS  2
                UNIT    bytes
                # 10Mb
                BANDWIDTH 10240
                DISPLAYVALUE 1
                ARROW   normal
                GROUP   sites
                INTERNODEDISPLAY 50
A quick test to make sure everything is working properly:
weathermap4rrd -c /etc/weathermap4rrd/weathermap4rrd.sites.conf
And our result is in /var/www/weathermap/weathermap_sites.png. We can make some position adjustments or other cosmetic checks.
Not working? Don’t panic, use the –debug switch on the command line to get more information about what’s happening.
The hardest part is done, but now we need to automatically update this data and present it to the world.
Publish the Graphs
We’ll quickly define a virtualhost for our application:
  <VirtualHost *>
        ServerAdmin nico@rottenbytes.info
        ServerName weathermap.rottenbytes.info
        DocumentRoot /var/www/weathermap
        <Directory />
                Options FollowSymLinks
                AllowOverride None
        </Directory>
        <Directory /var/www/weathermap>
                Options Indexes FollowSymLinks MultiViews
                AllowOverride None
                Order allow,deny
                allow from all
        </Directory>
        ErrorLog /var/log/apache2/error.log
        LogLevel warn
        CustomLog /var/log/apache2/access.log combined
        ServerSignature Off
</VirtualHost>
We also need a small script to regenerate all this:
  #!/bin/sh
weathermap4rrd -c /etc/weathermap4rrd/weathermap.sites.conf
convert /var/www/weathermap/weathermap_sites.png -resize 25% /var/www/weathermap/weathermap_sites_t.png
We’ll create the following entry in the crontab:
*/2 * * * * /opt/scripts/weathermap.sh
To recreate the graphs every 2 minutes, even though Cacti polls by default every 5 minutes, we’ll have more “up-to-date” data this way.
As a finishing touch, this script creates a thumbnail with convert (from the ImageMagick package) at 25% of the original size, which will perfectly complement the (very basic) page to use as an index for our vhost:
  <html>
  <head>
    <title>Network Usage</title>
  </head>
  <body>
    <center>
      <h1>Network Usage</h1>
      <em>(data updated every 5 minutes)</em>
    </center>
    <p>
      France/data<br /><a href="weathermap_sites.png">
        <img src="weathermap_sites_t.png" border="0"
      /></a>
    </p>
  </body>
</html>
That’s it! This article is finished and I hope it has inspired you to do the same thing in your environment.
Resources
Last updated 27 Nov 2009, 17:32 +0200.