Setting up a distributed monitoring solution with Nagios, CheckMK and Thruk
![]()
| Software version | Nagios 3 Check Mk 1.1.12p7 Thruk 1.30 |
| Operating System | Debian 6 |
| Last Update | 28/06/2012 |
Introduction
Before starting with this documentation, it’s recommended to be familiar with certain tools. Here’s the list with associated documentation:
The purpose of this documentation is to install a Thruk server capable of displaying information from different remote Nagios servers:
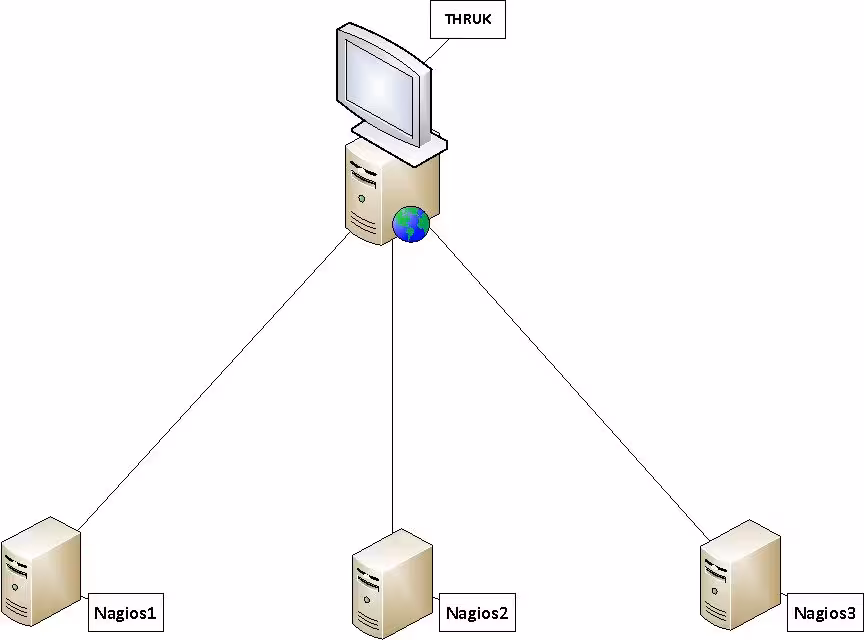
This diagram will be our reference throughout the tutorial.
We will need 4 servers with the following services installed:
- SRV-THRUK: Apache & Thruk which will be our “display” server.
- SRV-NAGIOS1: Nagios & Check Mk which will be a Nagios server to monitor part x of our infrastructure
- SRV-NAGIOS2: Nagios & Check Mk which will be a Nagios server to monitor part y of our infrastructure
- SRV-NAGIOS3: Nagios & Check Mk which will be a Nagios server to monitor part z of our infrastructure
In the end, we want to get decentralized screens without any dependency between them:

Thruk: Display Server
Installation
Let’s start with the installation of Apache2
aptitude install apache2
Now that Apache2 is installed, let’s download Thruk:
  dpkg -i thruk_version.deb
apt-get -f install
You can now access your Thruk interface by typing this in your browser: http://localhost/thruk
The login and password are: thrukadmin
Configuration
The Thruk configuration is primarily initialized by two files:
- thruk.conf: This is the global Thruk configuration that should not be modified!
- thruk_local.conf: This is the customizable configuration, which will be loaded by thruk.conf
Let’s edit our /etc/thruk/thruk_local.conf as follows:
  <Component Thruk::Backend>
<peer>                                                 #First remote Nagios
      name   = srv-nagios1                             #Connection name, this name will be displayed on Thruk
      type   = livestatus                              #Connection type
      <options>
          peer   = 192.168.0.37:6557                    #IP address of the Nagios server and port used by livestatus (ref. 2-Configuration)
     </options>
  </peer>

<peer>                                                 #Second remote Nagios
      name   = srv-nagios2
      type   = livestatus
      <options>
          peer   = 192.168.0.27:6557
     </options>
  </peer>

<peer>                                                  #Third remote Nagios
      name   = srv-nagios3
      type   = livestatus
      <options>
          peer   = 192.168.0.162:6557
     </options>
  </peer>

</Component>
To finish, just start the Thruk service:
service thruk start
The configuration of our SRV-THRUK doesn’t require any other modifications in our case, so we can move on to the installation of the Nagios and CheckMK servers.
Nagios & CheckMk: Monitoring Servers
Installation
First, let’s take care of Nagios3:
aptitude install nagios3
Then the famous plugin for Nagios, Check Mk:
  aptitude install xinetd gcc g++ libc6-dev make libapache2-mod-python         #Required dependencies
wget http://mathias-kettner.de/download/check_mk-1.2.0p1.tar.gz              #Download check_mk
tar -zvxf check_mk-version.tar
cd check_mk-version/
./setup.sh
Use the setup with default options. If needed, refer to the CheckMk documentation for more information. Then install the agent:
  wget http://mathias-kettner.de/download/check-mk-agent_1.2.0p1-2_all.deb
dpkg -i check-mk-agent_version.deb
Configuration
The livestatus file is essential in our implementation, as it’s where we specify the port used by livestatus, the IP address of our remote Thruk server and the path of the socket used.
Use the following example for the /etc/xinetd.d/livestatus file. This livestatus file needs to be created, be careful not to insert comments in the configuration file:
  service livestatus
{
 type = UNLISTED
 port = 6557                                     #Port used by the livestatus service => thruk_local.conf
 socket_type = stream
 protocol = tcp
 wait = no
 cps = 100 3
 instances = 500
 per_source = 250
 flags = NODELAY
 user = nagios
 server = /usr/bin/unixcat
 server_args = /var/lib/nagios3/rw/live          #Path of the socket used
 only_from = 192.168.0.190                        #IP address of our SRV-THRUK
 disable = no
}
Finally, we need to restart our service:
/etc/init.d/xinetd restart
Let’s create the directory containing the socket (live), and assign it permissions:
  mkdir -p /var/lib/nagios3/rw/
touch /var/lib/nagios3/rw/live
chown -Rf nagios. /var/lib/nagios3
We also need to edit the Nagios configuration to enter the path of our socket
The file to edit is /etc/nagios3/nagios.cfg:
  # Load Livestatus
Modulebroker_module=/usr/lib/check_mk/livestatus.o /var/lib/nagios3/rw/live  #Path corresponding to our socket
event_broker_options=-1
Restart Nagios3
/etc/init.d/nagios3 restart
If you want to test your socket and retrieve information from it:
  echo 'GET services' | unixcat /var/lib/nagios3/rw/live
echo 'GET hosts' | unixcat /var/lib/nagios3/rw/live
Last updated 28 Jun 2012, 07:39 CEST.