Memory Caches
| Software version | Kernel 2.6.32+ |
| Operating System | Red Hat 6.3 Debian 7 |
| Website | Kernel Website |
| Last Update | 12/09/2012 |
Page Allocation
Delaying memory allocation when a process requests it is good for performance. Due to reference locality, most programs that request large memory allocations don’t allocate all of it at once. For program memory allocation, it will be done gradually to avoid using more than necessary.
It’s important to understand that there is also priority management based on who makes the request. For virtual memory allocation, for example, when the kernel makes a request, the memory is allocated immediately, whereas a user request will be handled gradually as needed. There are good reasons for these allocation choices. In fact, many RAM-intensive programs have sections that are rarely used. It’s therefore unnecessary to load everything into memory if not everything is used. This helps avoid memory waste. A process whose memory allocation has been delayed during the last minute is referenced as being in demand for pagination.
It’s possible to tune this allocation a bit for applications that typically allocate large blocks and then free the same memory. It also works well for applications that allocate a lot at once and then quit. You need to adjust the sysctl settings:
vm.min_free_kbytes=<value>
This helps reduce pagination request times; memory is only used for what it really needs, and it can put pressure on ZONE_NORMAL1.
Overcommit Management
It’s advantageous for certain applications to let the kernel allocate more memory than the system can offer. This can be done with virtual memory. Using the vm.overcommit_memory parameter in sysctl, it’s possible to ask the kernel to allow an application to make many small allocations:
vm.overcommit_memory=1
To disable this feature:
vm.overcommit_memory=0
It’s also possible to use value 2. This allows overcommitting by an amount equal to the swap size + 50% of physical memory. The 50% can be changed via the ratio parameter:
  vm.overcommit_memory=2
vm.overcommit_ratio=50
To estimate the RAM size needed to avoid an OOM (Out Of Memory) condition for the current system workload:
  > grep -i Committed_AS /proc/meminfo
Committed_AS:    3458788 kB
Generally, overcommit is useful for scientific applications or those created in Fortran.
Slab Cache
The Slab cache contains pre-allocated memory pools that the kernel will use when it needs to provide space for different types of data structures. When these data structures map only very small pages or are so small that several of them fit into a single page, it’s more efficient for the kernel to allocate pre-allocated memory from the Slab memory space. To get this information:
  > cat /proc/slabinfo
slabinfo - version: 2.1
# name            <active_objs> <num_objs> <objsize> <objperslab> <pagesperslab> : tunables <limit> <batchcount> <sharedfactor> : slabdata <active_slabs> <num_slabs> <sharedavail>
ext4_groupinfo_1k     31     60    128   30    1 : tunables  120   60    8 : slabdata      2      2      0
jbd2_1k                0      0   1024    4    1 : tunables   54   27    8 : slabdata      0      0      0
ext4_groupinfo_4k   7419   7420    136   28    1 : tunables  120   60    8 : slabdata    265    265      0
ext4_inode_cache   98966  98980    872    4    1 : tunables   54   27    8 : slabdata  24745  24745      0
ext4_xattr             0      0     88   44    1 : tunables  120   60    8 : slabdata      0      0      0
ext4_free_data         1     67     56   67    1 : tunables  120   60    8 : slabdata      1      1      0
ext4_allocation_context      8     28    136   28    1 : tunables  120   60    8 : slabdata      1      1      0
ext4_prealloc_space     31     37    104   37    1 : tunables  120   60    8 : slabdata      1      1      0
ext4_system_zone       0      0     40   92    1 : tunables  120   60    8 : slabdata      0      0      0
ext4_io_end            1      3   1128    3    1 : tunables   24   12    8 : slabdata      1      1      0
ext4_io_page          53    202     16  202    1 : tunables  120   60    8 : slabdata      1      1      0
jbd2_inode          1775   2002     48   77    1 : tunables  120   60    8 : slabdata     26     26      0
jbd2_journal_handle     64    144     24  144    1 : tunables  120   60    8 : slabdata      1      1      0
jbd2_journal_head    590    680    112   34    1 : tunables  120   60    8 : slabdata     20     20      0
jbd2_revoke_table     10    202     16  202    1 : tunables  120   60    8 : slabdata      1      1      0
jbd2_revoke_record      0      0     32  112    1 : tunables  120   60    8 : slabdata      0      0      0
kcopyd_job             0      0   3240    2    2 : tunables   24   12    8 : slabdata      0      0      0
io                     0      0     64   59    1 : tunables  120   60    8 : slabdata      0      0      0
dm_uevent              0      0   2608    3    2 : tunables   24   12    8 : slabdata      0      0      0
dm_rq_clone_bio_info      0      0     16  202    1 : tunables  120   60    8 : slabdata      0      0      0
dm_rq_target_io        0      0    408    9    1 : tunables   54   27    8 : slabdata      0      0      0
dm_target_io         856    864     24  144    1 : tunables  120   60    8 : slabdata      6      6      0
dm_io                798    920     40   92    1 : tunables  120   60    8 : slabdata     10     10      0
bio-1                  7     20    192   20    1 : tunables  120   60    8 : slabdata      1      1      0
sd_ext_cdb             2    112     32  112    1 : tunables  120   60    8 : slabdata      1      1      0
scsi_sense_cache      60     60    128   30    1 : tunables  120   60    8 : slabdata      2      2      0
scsi_cmd_cache        45     45    256   15    1 : tunables  120   60    8 : slabdata      3      3      0
uhci_urb_priv          3     67     56   67    1 : tunables  120   60    8 : slabdata      1      1      0
sgpool-128             2      2   4096    1    1 : tunables   24   12    8 : slabdata      2      2      0
sgpool-64              2      2   2048    2    1 : tunables   24   12    8 : slabdata      1      1      0
[...]
For a less detailed view:
  > vmstat -m
Cache                       Num  Total   Size  Pages
ext4_groupinfo_1k            31     60    128     30
jbd2_1k                       0      0   1024      4
ext4_groupinfo_4k          7419   7420    136     28
ext4_inode_cache          98971  98984    872      4
ext4_xattr                    0      0     88     44
ext4_free_data               18     67     56     67
ext4_allocation_context      16     28    136     28
ext4_prealloc_space          37     37    104     37
ext4_system_zone              0      0     40     92
ext4_io_end                   2      3   1128      3
ext4_io_page                 73    202     16    202
jbd2_inode                 1814   2002     48     77
jbd2_journal_handle           9    144     24    144
jbd2_journal_head           609    680    112     34
jbd2_revoke_table            10    202     16    202
jbd2_revoke_record            0      0     32    112
kcopyd_job                    0      0   3240      2
io                            0      0     64     59
dm_uevent                     0      0   2608      3
dm_rq_clone_bio_info          0      0     16    202
dm_rq_target_io               0      0    408      9
dm_target_io                803    864     24    144
dm_io                       801    920     40     92
[...]
There’s also a utility that allows you to monitor this Slab cache in real time, you can use the slabtop command:
  > slabtop
 Active / Total Objects (% used)    : 468837 / 561926 (83,4%)
 Active / Total Slabs (% used)      : 46669 / 46681 (100,0%)
 Active / Total Caches (% used)     : 108 / 186 (58,1%)
 Active / Total Size (% used)       : 158581,33K / 169955,34K (93,3%)
 Minimum / Average / Maximum Object : 0,02K / 0,30K / 4096,00K

  OBJS ACTIVE  USE OBJ SIZE  SLABS OBJ/SLAB CACHE SIZE NAME
154993  80496  51%    0,10K   4189       37     16756K buffer_head
119300 119300 100%    0,19K   5965       20     23860K dentry
 99016  99012  99%    0,85K  24754        4     99016K ext4_inode_cache
 28615  24772  86%    0,06K    485       59      1940K size-64
 18810  18601  98%    0,17K    855       22      3420K vm_area_struct
 15561  12820  82%    0,55K   2223        7      8892K radix_tree_node
 15045  14103  93%    0,25K   1003       15      4012K filp
 14715  14674  99%    0,14K    545       27      2180K sysfs_dir_cache
 14560  11186  76%    0,03K    130      112       520K size-32
 12474  11745  94%    0,05K    162       77       648K anon_vma_chain
  9420   9218  97%    0,62K   1570        6      6280K shmem_inode_cache
  9120   8814  96%    0,50K   1140        8      4560K size-512
[...]
When a process references a file, the kernel creates and associates a ‘dentry object’ for each element in its pathname. For example, for /home/pmavro/.zshrc, the kernel will create 4 ‘dentry objects’:
- /
- home
- pmavro
- zshrc
Each dentry object points to the inode associated with its file. To avoid reading from disk each time these same paths are used, the kernel uses the dentry cache where dentry objects are stored. For the same reasons, the kernel also caches information about inodes, which are therefore contained in the slab.
The ARP Cache
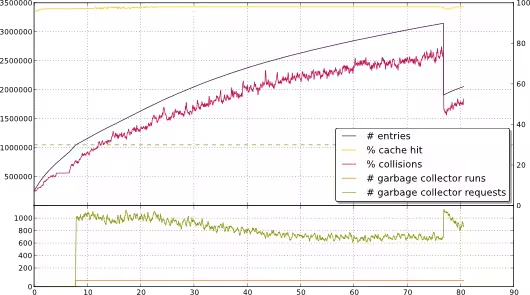
Many network performance problems can be due to the ARP cache being too small. By default, it’s limited to 512 soft entries and 1024 hard entries at the Ulimits level. The soft limit becomes a hard limit after 5 seconds. When this limit is exceeded, the kernel performs garbage collection and scans the cache to purge entries to stay below this limit. This garbage collector can also lead to a complete cache deletion. Let’s say your cache is limited to 1 entry but you’re connecting from 2 remote machines. Each incoming and outgoing packet will cause garbage collection and reinsertion into the ARP cache. There will therefore be a permanent change in the cache. To give you an idea of what can happen on a system:
To see the ARP entries that map hardware addresses to protocol addresses:
  > grep -i arp /proc/slabinfo
arp_cache              4      8    448    8    1 : tunables   54   27    8 : slabdata      1      1      0
Too many ARP entries in the cache put pressure on the ZONE_NORMAL. To list ARP entries, there are 2 solutions:
  > ip neighbor list
10.101.0.254 dev eth0 lladdr 00:25:45:db:71:57 REACHABLE
or
  > cat /proc/net/arp
IP address       HW type     Flags       HW address            Mask     Device
10.101.0.254     0x1         0x2         00:25:45:db:71:57     *        eth0
To clear the ARP cache:
ip neighbor flush dev eth0
You can make some ARP cache adjustments by specifying the soft limit, hard limit, and how often the garbage collector should run (in seconds):
  net.ipv4.neigh.default.gc_thresh2=<soft_value>
net.ipv4.neigh.default.gc_thresh3=<hard_value>
net.ipv4.neigh.default.gc_interval=<gc_intrval_value>
There is also another option that allows you to set the minimum time of jiffies in user space to cached entries. There are 100 jiffies in user space in 1 second:
net.ipv4.neigh.default.locktime=<value>
Page Cache
A very large percentage of pagination activity is due to IO. For reading from disk to memory for example, it forms page cache. Here are the cases of page cache verification for IO requests:
- Reading and writing files
- Reading and writing via block device files
- Access to memory-mapped files
- Access that swaps pages
- Reading directories
To see the page cache allocations, just look at the buffer caches:
  > grep -i buffer /proc/meminfo
Buffers:          225624 kB
It’s possible to tune the page cache memory size:
  vm.lowmem_reserve_ratio=<value>
vm.vfs_cache_presure=<value>
And it’s also possible to tune the arrival rate:
  vm.page-cluster=<value>
vm.zone_reclaim_mode=<value>
Anonymous Pages
In Linux, only certain types of pages are swapped. There’s no need to swap text-type programs because they already exist on disk. Also, for memory that has been used to store files with modified content, the kernel will take the lead and write the data to the file it belongs to rather than to swap. Only pages that have no association with a file are written to swap.
The swap cache is used to keep track of pages that have previously been taken out of swap and haven’t been re-swapped since. If the kernel swaps threads that need to swap a page later, if it finds an entry for this page in the swap cache, it’s possible to swap without having to write to disk.
The statm file for each PID allows you to see anonymous pages (here PID 1):
  > cat /proc/1/statm
2659 209 174 9 0 81 0
- 2659: total program size
- 209: resident set size (RSS)
- 174: shared pages (from shared mappings)
- 9: text (code)
- 81: data + stack
This therefore contains the RSS and shared memory used by a process. But actually the RSS provided by the kernel consists of anonymous and shared pages, hence:
Anonymous Pages = RSS - Shared
SysV IPC
Another thing that consumes memory is the memory for IPC communications.
Semaphores allow 2 or more processes to coordinate access to shared resources.
Message Queues allow processes to coordinate for message exchanges. Shared memory regions allow processes to communicate by reading and writing to the same memory regions.
A process may wish to use one of these mechanisms but must make appropriate system calls to access the desired resources.
It’s possible to put limits on these IPCs on SYSV systems. To see the current list:
  > ipcs -l

------ Shared Memory Limits --------
max number of segments = 4096
max seg size (kbytes) = 32768
max total shared memory (kbytes) = 8388608
min seg size (bytes) = 1

------ Semaphore Limits --------
max number of arrays = 128
max semaphores per array = 250
max semaphores system wide = 32000
max ops per semop call = 32
semaphore max value = 32767

------ Messages Limits --------
max queues system wide = 7599
max size of message (bytes) = 8192
default max size of queue (bytes) = 16384
Using /dev/shm can be a solution to significantly reduce the service time of certain applications. However, be careful when using this system as temporary storage space because it’s in memory. There’s also an ‘ipcrm’ command to force the deletion of shared memory segments. But generally, you’ll never need to use this command.
It’s possible to tune these values (present in /proc/sys/kernel) via sysctl:
  > cat sem
250	32000	32	128
- 250: maximum number of semaphores per semaphore array
- 32000: maximum number of semaphores allocated on the system side
- 32: maximum number of operations allocated per semaphore system call
- 128: number of semaphore arrays
If you want to modify them:
kernel.sem = 250 256000 32 1024
There are other interesting parameters (with their default values):
  # Maximum number of bytes in a message queue
kernel.msgmnb=16384
# Maximum number of message identifiers in the queue
kernel.msgmni=16
# Maximum size of a message that can be passed to a process (this memory cannot be swapped)
kernel.msgmax=8192
# Maximum number of shared memory segments on the system side
kernel.shmmni=4096
# Maximum size of shared memory segments that can be created. A 32-bit system supports up to 4G - 1 maximum
kernel.shmmax=33554432
# Total amount of shared memory in pages that can be used at once on the system side. This value must be at least kernel.shmmax/PAGE_SIZE (4KiB on 32-bit)
kernel.shmall=2097152
For more information, see the man page for proc(5).
Getting Memory Information
There are several solutions for retrieving memory sizes. The most well-known is the free command:
  > free -ltm
             total       used       free     shared    buffers     cached
Mem:          3801       3520        281          0        224       1822
Low:          3801       3520        281
High:            0          0          0
-/+ buffers/cache:       1473       2328
Swap:         3811          4       3807
Total:        7613       3524       4089
You can also get information from dmesg. As we’ve seen above, it’s possible to get the total size of virtual space from meminfo:
  > grep -i vmalloc /proc/meminfo
VmallocTotal:   34359738367 kB
VmallocUsed:      560128 kB
VmallocChunk:   34359113168 kB
To see the largest free chunk size:
  > grep -i chunk /proc/meminfo
VmallocChunk:   34359113168 kB
For page tables:
  > vmstat -s
      3892968 K total memory
      3585172 K used memory
      1991172 K active memory
      1348148 K inactive memory
       307796 K free memory
       230100 K buffer memory
      1822744 K swap cache
      3903484 K total swap
         4140 K used swap
      3899344 K free swap
       397323 non-nice user cpu ticks
         6518 nice user cpu ticks
       102540 system cpu ticks
      5898943 idle cpu ticks
       146534 IO-wait cpu ticks
            1 IRQ cpu ticks
         1476 softirq cpu ticks
            0 stolen cpu ticks
     24899538 pages paged in
     24575197 pages paged out
           43 pages swapped in
         1061 pages swapped out
     38389133 interrupts
     74156999 CPU context switches
   1347436271 boot time
       171650 forks
For IO allocations, there’s iomem:
  > cat /proc/iomem
00000000-0000ffff : reserved
00010000-0009fbff : System RAM
0009fc00-0009ffff : RAM buffer
000a0000-000bffff : PCI Bus 0000:00
000c0000-000effff : PCI Bus 0000:00
  000c0000-000c7fff : Video ROM
  000ce800-000cffff : Adapter ROM
000f0000-000fffff : PCI Bus 0000:00
  000f0000-000fffff : reserved
    000f0000-000fffff : System ROM
00100000-cd9ffbff : System RAM
  01000000-01354585 : Kernel code
  01354586-0169367f : Kernel data
  01727000-01805fff : Kernel bss
cd9ffc00-cda53bff : ACPI Non-volatile Storage
cda53c00-cda55bff : ACPI Tables
cda55c00-dfffffff : reserved
  cdb00000-dfffffff : PCI Bus 0000:00
    d0000000-dfffffff : 0000:00:02.0
e0000000-efffffff : PCI MMCONFIG 0000 [bus 00-ff]
  e0000000-efffffff : reserved
f0000000-fed003ff : reserved
  f0000000-fec00000 : PCI Bus 0000:00
    f0000000-f01fffff : PCI Bus 0000:02
[...]
References
Last updated 12 Sep 2012, 16:58 CEST.