Gnuplot: Graph Data Easily
![]()
Introduction
Gnuplot is a flexible program that can produce graphical representations in two or three dimensions of numerical functions or data. The program works on all major computers and operating systems and can send graphics to the screen or into files in many formats. Gnuplot also uses the Levenberg-Marquardt algorithm to fit parameters of a numerical function to experimental data.
The program is distributed under a free software license that allows copying and modifying the source code of the program. Modified versions of the program can only be distributed as patch files. The program has no connection to the GNU project and does not use the copyleft GPL license.
The program can be used interactively and comes with online help. The user enters command line instructions that produce a plot. It is also possible to write Gnuplot scripts that, when executed, generate a graph.
Installation
Debian
On Debian, here’s how to install it:
aptitude install gnuplot
Red Hat
On Red Hat, here’s how to install Gnuplot:
yum install gnuplot
Usage
We need to store our information somewhere:
  for i in {1..3600} ; do
   uptime | awk '{ print $1, $(NF-2), $(NF-1), $NF}' | tr -d ',' >> ~/gnuplot_datas/load_average.datas
   sleep 1
done
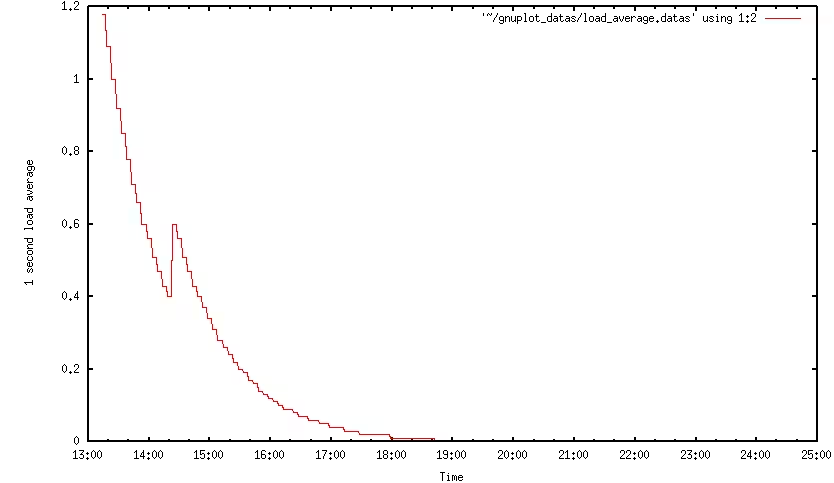
Run the script. It will run every second and store the date with the load average for 1 hour. We will then have a data file that we can output as a graph with gnuplot. Let’s create a configuration file for Gnuplot:
  set term png crop
set output '~/gnuplot_datas/load_average.png'
set xdata time
set timefmt '%H:%M:%S'
set xlabel 'Time'
set ylabel ' 1 second load average'
set yrange [0:]
plot '~/gnuplot_datas/load_average.data' using 1:2 with lines
I won’t explain each line, as they seem quite self-explanatory. Now we can generate a graph with Gnuplot:
gnuplot -persist ~/gnuplot_datas/load_average.gplot
This will give us a graph like this:
You can find plenty of examples on the official Gnuplot website.
Last updated 26 Dec 2011, 20:33 +0200.