Linux Process and Scheduler Management
| Software version | Kernel 2.6.32+ |
| Operating System | Red Hat 6.3 Debian 7 |
| Website | Kernel Website |
| Last Update | 04/09/2012 |
Processes
To list processes, it’s very simple:
ps aux
If you want to select only certain columns:
ps axo pid,comm,stat --sort=stat
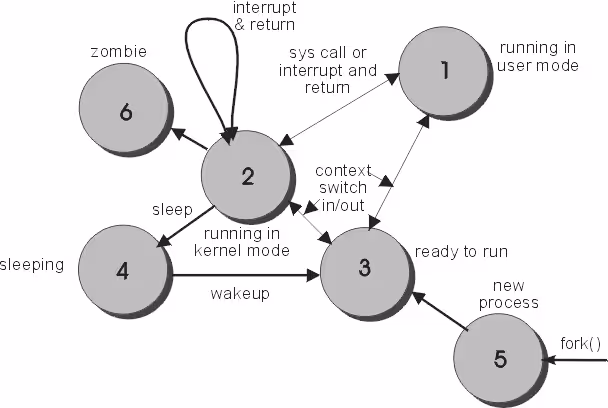
Here are the 6 operating modes we can find:
- Execution in user mode
- Execution in kernel mode
- Ready to be launched
- Sleeping
- Newly created, not yet ready to be launched and not asleep
- Problem during closure (zombie)
Here is the official list of process states:
- TASK_RUNNING: When a process is running or ready to be launched
- TASK_INTERRUPTABLE: This state is a blocking state that waits for an event or a signal from another process
- TASK_UNINTERRUPTABLE: This state is a blocking state, the process is forced to close because the hardware was waiting for a signal that was never received
- TASK_STOPPED: Once the process is finished, this state appears. The process can be restarted.
- TASK_ZOMBIE: In this state the process has been stopped and the information will still be available in the process list
Processor caches
Memory caches are organized in lines. Each line corresponds to a memory space. All computers have different caches with different processor instructions (depending on processors) including I-cache, D-cache, Altivec, etc.
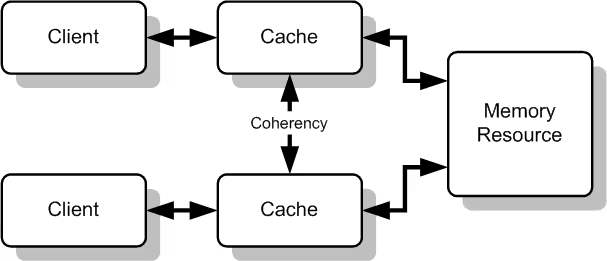
On a system with multiple processors/cores, each core has its own cache associated with a controller. When a processor references the main memory, each controller will first check if the request is in its cache to respond to the request. Depending on whether the response exists (cache hit) or doesn’t exist (cache miss), the response will be very fast, or will take a little longer because it will have to access memory to be brought to the cache.
The cache controller contains a table with all entries for each line present in the cache. The controller uses tags and flags to give a status to each line present in the cache. Processors read and write their cache to memory. In the case of a write, the cache can be configured as:
- write-through: when a cache line is updated, the main memory must also be updated.
- write-back: there is no writing to the cache and main memory until the cache line is released.
Write back is much more performant than write through. On x86 platforms under Linux, the write-back cache is used. Each memory page has a bit to disable this page cache and the write-back cache.
On multi-processor systems, there is a need to maintain a certain coherence between caches. When a cache updates a memory space, it must notify the occupation of this space to other caches. This is called cache snooping and it’s the hardware that manages this part.
NUMA (for Non Uniform Memory Access or Non Uniform Memory Architecture) is a cache snooping method, meaning non-uniform memory access and non-uniform memory architecture) is a multiprocessor system in which memory areas are separated and placed in different locations (and on different buses). From the perspective of each processor, access times therefore differ depending on the memory area accessed. The NUMA system was designed to overcome the limitations of the SMP architecture in which the entire memory space is accessible by a single bus causing concurrent access problems by different processors. This is particularly necessary for systems with many processors.3
Types
There are currently 3 types of cache:
- L1 (Level 1): Level 1 caches (Fully associative cache) are the most flexible and also the most expensive because they require a lot of circuits for their implementation. It can only contain a few kB
- L2 (Level 2): Level 2 caches (Set associative cache), they are a good compromise (cost/speed) between L1 and L3.
- L3 (Level 3): Level 3 caches (Cache). This cache is the slowest of all, but still provides access much faster than RAM: ~8n/sec
Today, the fastest memories are processor registers. These registers run at the same speed as the processor clock.
To know your processor caches:
  > getconf -a | grep CACHE
LEVEL1_ICACHE_SIZE                 32768
LEVEL1_ICACHE_ASSOC                8
LEVEL1_ICACHE_LINESIZE             64
LEVEL1_DCACHE_SIZE                 32768
LEVEL1_DCACHE_ASSOC                8
LEVEL1_DCACHE_LINESIZE             64
LEVEL2_CACHE_SIZE                  6291456
LEVEL2_CACHE_ASSOC                 24
LEVEL2_CACHE_LINESIZE              64
LEVEL3_CACHE_SIZE                  0
LEVEL3_CACHE_ASSOC                 0
LEVEL3_CACHE_LINESIZE              0
LEVEL4_CACHE_SIZE                  0
LEVEL4_CACHE_ASSOC                 0
LEVEL4_CACHE_LINESIZE              0
On this processor, I have 32KB of cache in L1 and 6MB of cache in L2. I don’t have L3 (nor L4 as you can see, but this cache is very uncommon). You can also look on the manufacturer’s website and get information about it.
Locating losses
It is possible to locate memory losses and processor cache usage via a tool called Valgrind4 (For a good tutorial on how to use it follow this link5)
With Valgrind, it is possible to specify the cache to profile with –l1, –D1 or –L2. However, be aware that the program will be slower during a Valgrind analysis.
A program provides good performance when cache accesses are successful. The ‘cache stride’ is used to reference a certain amount of memory that can be cached in a single cache line. Most programs tend to use x memory blocks + 1 in their next execution cycles. That’s why it’s more interesting to move a block of data from disk to memory rather than doing it bit by bit. When a program accesses the same data in memory multiple times during a certain period of time, it is called “Temporal locality of reference”.
Some processors have special access to memory to go through the cache. In some cases, if the program gets a lot of “cache misses”, slowdowns will be felt. That’s why this option is available in some processors.
Compilation optimizations
It is possible to make optimized code with GCC. By default, it is disabled due to compilation time concerns and to produce error code that is easier to debug.
Here are some options6:
- O0: This level (letter “O” followed by a zero) completely disables optimization, it is the default level if no -O level is specified in the CFLAGS or CXXFLAGS variables. Your code will not be optimized: this is generally not what is wanted.
- O1: This is the most classic level of optimization. The compiler will try to generate faster and lighter code without taking more time to compile. It’s relatively classic, but it should work in all cases. that the job is done.
- O2: A step above -O1. This is the recommended level of optimization unless you have specific needs. The -O2 level will activate some options in addition to those of -O1. With the -O2 level, the compiler will attempt to increase the performance of the code without compromising on size and without taking too much time to compile.
- O3: This is the highest possible level of optimization but also the riskiest. Compilation time will be longer with this option which in fact should not be used globally with GCC 4.x. The behavior of GCC has changed significantly since version 3.x. In version 3.x, -O3 showed that its use led to marginally faster execution times than with -O2, but this is no longer the case with GCC 4.x. Compiling all your packages with -O3 will produce larger binaries which will require more memory and will significantly increase strange compilation errors or cause unexpected behavior for programs (including errors). The disadvantages outweigh the advantages; remember the principle of diminishing returns. Using the -O3 level is not recommended for GCC 4.x.
- Os: This level will optimize your code for size. It activates all options of the -O2 level that do not affect the size of the generated code. It can be useful for machines that have a very limited amount of free disk space and/or that have processors with a small cache size. However, this level can quite cause other problems, which is why it is filtered by many ebuilds in the tree. The use of -Os is not recommended.
Run Queues
The kernel creates 2 run queues for each core, an “active” and an “expired”. The 2 run queues are arrays with lists of links between them, one of which represents the priority level of tasks. When a process becomes “runnable”, it is placed in the “active” queue. When a task in the active queue has exceeded its expiration time, a new priority is calculated and assigned to it, then a link is placed to it in the expired queue. When all processes in the active queue have exceeded their time limit, all tasks are moved to the expired queue and it becomes the run queue.
The kernel scheduler does its best to maintain good performance and correct response times when there are multiple processors and a large number of processes.
Priorities
The kernel has 140 priority levels ranging from 0 to 139 (from highest to lowest). Priorities from 0 to 99 correspond to real time. For the last 40, these are ordinary dynamic processes. The standard priority being 120 which corresponds to what is generally seen: 0. The visible priorities therefore range from -20 to +20 which correspond to 99 to 139.
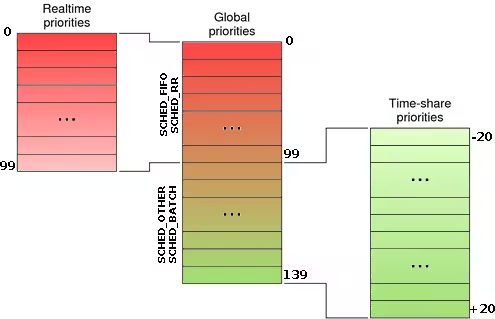
What you need to know about schedulers:
- SCHED_FIFO for a non-preemptible real-time process,
- SCHED_RR for a preemptible real-time process,
- SCHED_OTHER for an ordinary (non-real-time) process.
SCHED_FIFO
To modify the priority of a process:
chrt -f [1-99] binary_path
SCHED_RR
To modify the priority of a process:
chrt -r [1-99] binary_path
SCHED_OTHER
This scheduler is used either by the kernel, or by a user who will vary its priority according to certain criteria. Each launched process has a priority of 0 by default which can be changed with the nice tools (when launching the application) or renice (once the application is launched). The scheduler will analyze processes that have been sleeping for too long and will increase their priority by -5 to give them a higher priority so they launch faster. Conversely, processes that spend their time running are penalized by +5. The scheduler will also give a boost to processes that ask for other processes to be launched such as graphical interfaces.
View process status
Of course, you know the top command that allows you to see all the processes on the machine. There is also this to see the priority and policy of a scheduler (indicate the PID number, here 8998):
  > chrt -p 8998
pid 8998's current scheduling policy: SCHED_OTHER
pid 8998's current scheduling priority: 0
You also have the ps command:
ps axo pid,comm,rtprio,policy
or
ps -Amo user,pid,tid,psr,pcpu,pri,vsz,rss,stat,time,comm
References
Last updated 04 Sep 2012, 13:12 CEST.