Debugging a JVM Crash
Introduction
You may have an application that has problems such as crashing, but the port and process remain up anyway. This happened to me particularly with Atlassian’s Confluence wiki.
Problem
The application crashes, yet it still remains up at the process and port level. Therefore, we need to debug the JVM.
I won’t explain in detail how a JVM works, but here are the basics:
- The minimum memory allocated to an application is defined by the Xms option. At startup, the application will consume the value of Xms (in this case 1GB).
- The maximum memory allocated to the application is defined by the Xmx option. The application will therefore reserve (in this case) 1GB of RAM that can be used only by the JVM.
- For choosing Xms and Xmx values, it’s sufficient to check the memory consumption (generally the application provides this information).
- Garbage Collections (GC or memory purging) happen regularly when reaching approximately 90% to 95% of Xmx. This frees up memory space from stored objects. The disadvantage is that when this Full GC operates, the application temporarily freezes. During this period, it’s no longer possible to access the application. Full GCs may chain together if the Xmx is too low since they launch too frequently, which can completely freeze the application.
Changing Boot Options
Here’s an example of how to enable loggc which will allow us to see if the JVM is doing too many GCs, or performing a Full GC:
| Configuration File |
|---|
  year=`date '+%y'`
month=`date '+%m'`
day=`date '+%d'`
hour=`date '+%H'`
minute=`date '+%M'`
time=$hour$minute
date=$year$month$day
LOGS=/var/www/confluence/logs
JAVA_OPTS="-Xms1024m -Xmx1024m $JAVA_OPTS -Djava.awt.headless=true -Xloggc:$LOGS/confluencegclog_$date$time.txt -Dcom.sun.management.jmxremote -Djava.net.preferIPv4Stack=true -XX:MaxPermSize=256m"
export JAVA_OPTS
These lines are typically placed in a file that will be executed when our Java application launches.
Analyzing the Logs
When we examine our logs, we can see if there are too many GCs. For example, here’s a case where everything crashed due to a Full GC:
| confluencegclog_$date$time.txt |
|---|
  34385.900: [GC 104787K->104783K(1048064K), 0.0117720 secs]
34385.912: [Full GC 104783K->104783K(1048064K), 0.5075120 secs]
34386.419: [GC 104783K->104783K(1048128K), 0.0064380 secs]
34386.426: [Full GC 104783K->104783K(1048128K), 0.5079230 secs]
34395.908: [GC 104787K->104783K(1048128K), 0.0115600 secs]
34395.919: [Full GC 104783K->104783K(1048128K), 0.5082900 secs]
34396.428: [GC 104783K->104783K(1048128K), 0.0131540 secs]
34396.441: [Full GC 104783K->104783K(1048128K), 0.5081760 secs]
34405.913: [GC 104787K->104783K(1048192K), 0.0118660 secs]
34405.925: [Full GC 104783K->104783K(1048192K), 0.5074950 secs]
34406.432: [GC 104783K->104783K(1048320K), 0.0124010 secs]
34406.444: [Full GC 104783K->104783K(1048320K), 0.5082180 secs]
47648.636: [GC 105297K->104783K(1048128K), 0.0107060 secs]
47648.647: [Full GC 104783K->104783K(1048128K), 0.5092390 secs]
47649.157: [GC 104783K->104783K(1048256K), 0.0118660 secs]
47649.168: [Full GC 104783K->104783K(1048256K), 0.5097090 secs]
I also recommend a graphical tool for analyzing GC logs made by HP called HPJmeter available here. Here’s what it looks like - you can very clearly see the Full GC problem:
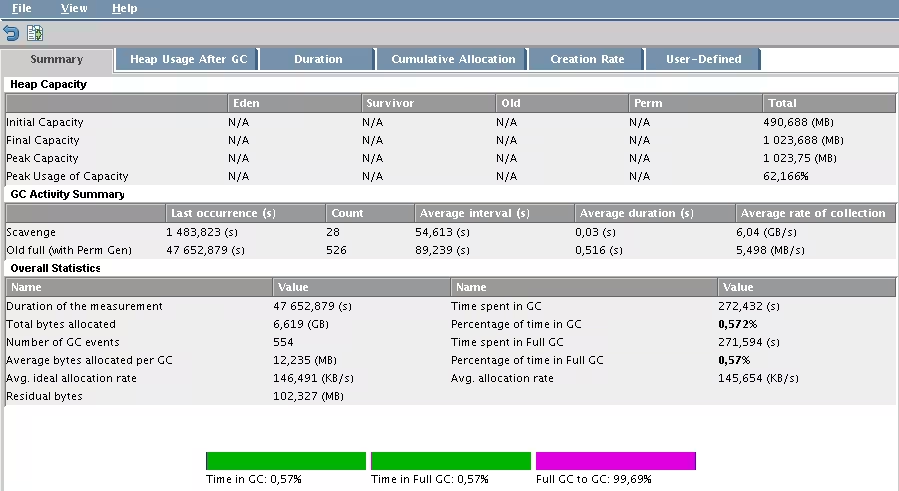
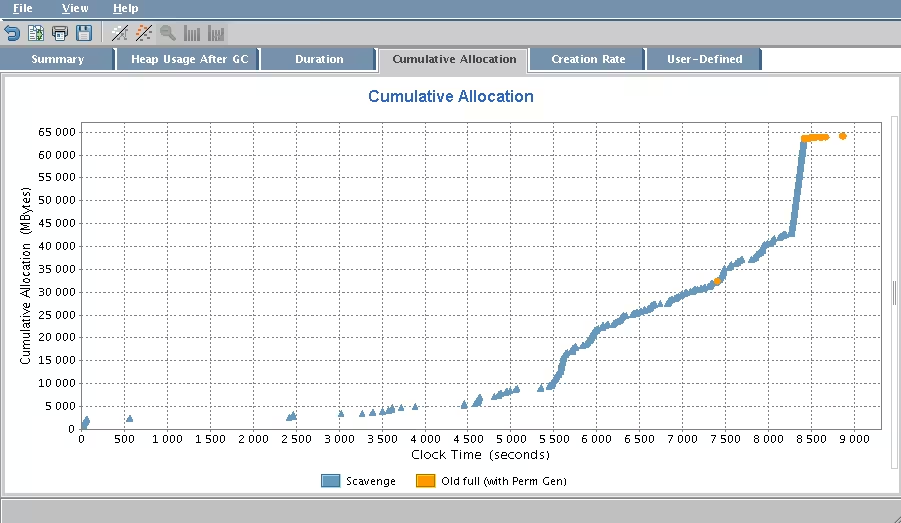
In the image above, we can clearly see that we’re experiencing a Full GC. And in the one below, we can see when it occurs:
Solutions
Solution 1: Increasing Xmx
We’ll increase the Xmx value as there may not be enough memory. In my case, I increased from 256MB to 1024MB to ensure my problem wasn’t coming from there. In the options, I just changed the Xmx and set Xms equal to Xmx.
Setting both (Xms and Xmx) to the same value prevents repetitive Garbage Collectors. The disadvantage is that objects won’t be purged as frequently as they should be. This may require manual intervention (planned manual stopping and restarting).
If the problem persists, proceed to solution 2.
Solution 2: The MaxPermSize Option
Even if increasing Xmx causes the application to freeze, the issue might be that the MaxPermSize option simply isn’t being applied. By default it’s 64MB and is part of the Xms. This is why Xms should be at least twice as large as MaxPermSize. Again, for peace of mind (and because my servers allow it), I decided to set this value to 256MB. After restarting the application, the problems disappeared.
Last updated 20 Apr 2008, 11:30 CEST.