Understanding Load Average
Introduction
The load average refers, in UNIX systems, to an average of the system load, a measure of the amount of work the system is doing during the considered period. This is available via the top or uptime commands.
For any system administrator, it is very important to understand how load average works in order to know the state of your servers.
Load Average acts on these elements:
- CPU
- RAM
- Network
- Disks
- Number of processes
- etc…
It’s important to understand that Load Average is a general indicator of the system.
It allows you to quickly know the state of a system without having to check everything manually. However, it will not tell us about the nature of the problem; we’ll need to fix that manually or use other tools to discover the cause of a high Load Average.
Load Average
You can get the Load Average via the Top command, uptime or in the file /proc/loadavg. For example:
09:35:44 up 1:13, 2 users, load average: 0.42, 0.27, 0.32
Some myths persist around this indicator, such as the fact that it should always be less than 1 or less than the number of available CPUs. But in practice, you’ll form your own opinion.
Definition
The 3 figures represent the average number (in the sense of a time-weighted average) of processes in a state of execution or waiting for a resource during the last 1, 5 and 15 minutes:
| 1 min | 5 min | 15 min |
|---|---|---|
| 0.42 | 0.27 | 0.32 |
Since this isn’t obvious for everyone, let’s recall a few concepts. Take a process for example, it can:
- Be running
- Be waiting for a resource (CPU or disk)
- Be doing nothing
For the calculation of Load Average, only the first two cases are taken into account.
The kernel regularly counts the number of processes that are working and updates its averages. This calculation is done every 5HZ kernel time intervals. HZ being a value in the kernel that defines the system’s time unit. It is defined as 1/HZ (default value at 100 on x86 architectures) of seconds.
The load average variables being updated every 5HZ intervals, this gives every 5 seconds. For tickless systems, this is still valid. The kernel provides, to the function calculating the averages, the number of ticks that would have elapsed in the case of a standard kernel.
Let’s now look at weighted averages. Without going into details, let’s say that this calculation method gives more weight to the latest values compared to the oldest ones. The decay of the weight of old values is actually exponentially decreasing.
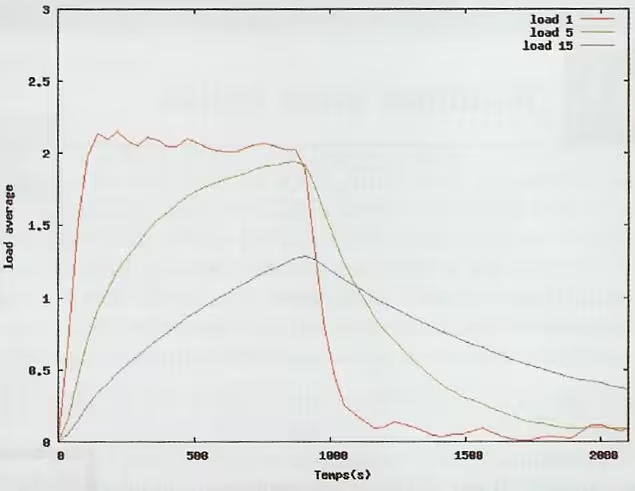
Example Curve
For example, in the curve below, we see the evolution of the load average over time. 2 processes were launched and then killed.
We see that the values did not evolve in the same way and that at times, we are even a bit above 2.
It is mathematically normal that the 1-minute load is more responsive than the 5-minute load and the 15-minute load (1 < 5 < 15).
When processes are killed, the reverse phenomenon of booting occurs.
Summary on the Definition of Load Average
In summary, the load average is the average number of processes using resources or wishing to do so. That’s good, we know a bit more about it, but we still don’t know how to interpret it simply.
A Visual Representation
Now that we know how it is calculated, we will analyze it.
From a process’s point of view, a machine can be seen as a set of resources: CPU, RAM, I/O, disks and network I/O. Processes will consume these different resources to play their role. We’ll first eliminate RAM from these processes, because it is actually contained in 2 others. Either:
- Looking for a page in memory, in which case we are using the CPU resource.
- We are swapping, and in this case, we are using the disk I/O resource.
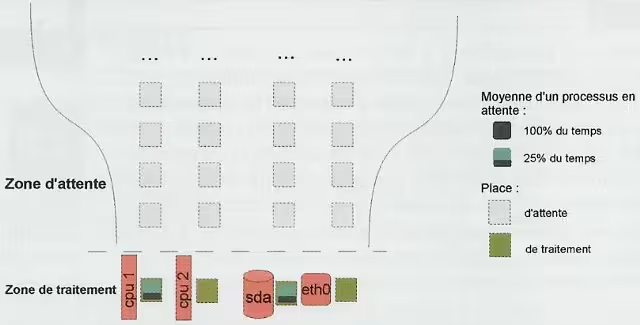
We’ll represent this system {processes; resources} in a funnel with, in the role of water drops, processes and, in the role of the pipe, resources. Our funnel is special because it has multiple outputs. One pipe per resource, each capable of accommodating one process.
- For CPU, this will make one for each logical processor.
- For disk I/O, we consider the number of devices and disks
- For the network, we take the number of active network cards
For a machine with a 2-core CPU, 1 disk and one network card:

Here the Load average is equal to 3.
Undersized Machine
In the previous example, the load is at 3 (on average 2 processes running and waiting for CPU). But for these processes, we only have 2 resources (the 2 CPUs). There is therefore permanently a process waiting. We can therefore consider that we are in a situation of contention on the CPU resource, and that here the machine would deserve additional CPUs.
Be careful, the situation above is not necessarily problematic. Indeed, imagine that a process with a low priority is constantly waiting or almost. It will raise the load average by 1.
But at the same time, if its priority is low, it’s because we wanted it that way. Is it so serious that it runs slower? After all, the processes that interest us run correctly despite everything?!
So, it’s not that serious. It all depends on the responsiveness we want on that famous low priority process.
Well-Sized Machine

Here we have a load average of 1.
If we have on average the situation above, we will have a load of 1. One might think that given that we use 1 resource out of 4, everything is fine, but it’s not that simple.
If we analyze: we have no processes waiting, and the CPU resource is fully used, but the others not at all. We could say that it’s impeccable, but we shouldn’t forget that the load is an average. As a result, we don’t know if it’s the same process that used a whole CPU or if several processes each consumed a part to finally take all the resource continuously.
- In the first case, we simply have a process that consumes an entire CPU. A faster CPU would be more appropriate.
- In the second case, since no process ran all the time, it means that in the end the CPU is used at half its capacity (there are 2 CPU resources and we have consumed one on average). Is this sufficient? We’ll see that…
We are beginning to see that the same load average value can have 2 completely different meanings depending on the applications on the system.
Oversized Machine?
Here is a load average of 0.5
In this 3rd case, we use 25% of CPU and 25% of disk I/O. Here at least, there is no contention, processes don’t wait to be served. We have finally found a case of low load average necessarily implying an unloaded machine? Mmmm not sure…
User Response Times
If we now place ourselves from a user’s point of view, the load average can have a harmful side.
Contradictory Analysis
Let’s analyze the 2 cases:
- Load average at 1 with 1 process consuming an entire resource (1 core)
- Load average at 0.5 with several processes consuming CPU and I/O
We would tend to say that in the 1st case we would need one more core and that in the 2nd case everything is fine.
Imagine, that we are playing a game where the number of FPS (Frame Per Seconds) is ideal at 60 and where it consumes an entire CPU. In the 1st case, we will always have the same load of 1 regardless of the CPU in question, but with totally different situations depending on the machines.
There is a load average/application relationship. With the second case, imagine that a single process is responsible for the load average. 0.5 per minute, it means that it only worked for 30 seconds.
But since it’s an average, maybe the program made the user wait almost 30s in a row. Maybe the user requested 60 web pages one after the other and each takes 0.5s to arrive.
To summarize, in the first case, the user is not satisfied because he does not necessarily have the desired FPS, and in the second case, it doesn’t matter, because 0.5s for each page is more than enough knowing that he will only consult one at a time.
User Expectations
Some applications such as reporting tools do not need to have a fast response time. Others, on the contrary, are not usable if we don’t have good performance, and where any additional gain can be useless (like games for example). Users can have different needs depending on the time of day (like for stock market applications).
Having this information on user expectations is crucial. As is the ability to compare them with objective values measured on applications.
The ideal is to be able to define application scenarios, to have the expected response times on these and to measure the times actually observed in order to check whether or not they are within the margins.
In the End
The load average is therefore not an ultimate value, able to say at first glance whether a machine is adequately sized or not, but in the absence of having anything else, we will make do with it largely.
References
Last updated 30 Nov 2008, 20:50 CET.